eBPF Dive
🧑🚀 published on Fri Mar 27 2026 · 7 min read
Ever wanted to run your own code inside the Linux kernel without writing a kernel module, without rebooting, and without breaking everything? That’s eBPF.
This post is a practical intro. I’ll cover how eBPF programs actually work, walk through a real example, explain the two ways to get data out of the kernel, and show how the userspace side ties it all together. At the end I’ll touch on the network security toolkit I’ve been building on top of this.
What is eBPF
eBPF stands for extended Berkeley Packet Filter. The name is historical baggage. Today it has nothing to do with packet filtering specifically. It’s a virtual machine embedded in the Linux kernel that lets you load and run sandboxed programs at specific hook points, without touching kernel source code.
The killer property is that it’s safe by design. Before your program runs, the kernel passes it through a verifier that checks for things like out-of-bounds memory access, unbounded loops, and null pointer dereferences. If it doesn’t pass, it doesn’t load. No crashes, no kernel panics.
Once verified, the JIT compiler converts the BPF bytecode to native machine code and attaches it to a hook. From that point on, every time that hook fires, your code runs at near-native speed, inside the kernel.
Hook points
eBPF programs don’t run on their own. They attach to events. The main ones you’ll use in practice:
- kprobe / kretprobe: fires on entry or return of any kernel function
- uprobe / uretprobe: same, but for userspace functions (think
SSL_write) - tracepoint: stable, documented kernel trace events
- XDP: packet processing at the NIC, before the kernel networking stack even sees the packet
- TC hook: traffic control, slightly later in the network path
The hook type you pick determines what context your program gets and what it’s allowed to do.
A real example: tracing execve
Let’s walk through something concrete. Every time a process executes a binary,
the kernel calls sys_execve. We’ll attach a kprobe to it and log the PID,
UID, and process name.
The eBPF program lives in two files: the kernel-side BPF C code, and the userspace loader that loads it and reads the output.
Kernel side
#include <linux/bpf.h>
#include <bpf/bpf_helpers.h>
#include <bpf/bpf_tracing.h>

struct event {
    __u32 pid;
    __u32 uid;
    char  comm[16];
};

struct {
    __uint(type, BPF_MAP_TYPE_RINGBUF);
    __uint(max_entries, 1 << 24);
} events SEC(".maps");

SEC("kprobe/sys_execve")
int trace_execve(struct pt_regs *ctx)
{
    struct event *e = bpf_ringbuf_reserve(&events, sizeof(*e), 0);
    if (!e)
        return 0;

    e->pid = bpf_get_current_pid_tgid() >> 32;
    e->uid = bpf_get_current_uid_gid() & 0xffffffff;
    bpf_get_current_comm(&e->comm, sizeof(e->comm));

    bpf_ringbuf_submit(e, 0);
    return 0;
}

char LICENSE[] SEC("license") = "GPL";
A few things to notice. The function signature takes struct pt_regs *ctx.
That’s the CPU register state at the moment the hook fired. It’s how the kernel
passes context into your program. The SEC() macro tells the compiler which ELF
section to put this symbol in, which is how the loader knows what type of program
it is and where to attach it.
The bpf_ringbuf_reserve / bpf_ringbuf_submit pair is how we ship data to
userspace. More on that below.
How context flows from kernel to eBPF
When a kprobe fires, the kernel saves the full CPU register state into a
pt_regs struct and hands your BPF program a pointer to it. That struct is your
window into what was happening at the exact moment the hook fired.
sys_execve(filename, argv, envp)
                |
         CPU registers:
         rdi = filename   ← PT_REGS_PARM1(ctx)
         rsi = argv       ← PT_REGS_PARM2(ctx)
         rdx = envp       ← PT_REGS_PARM3(ctx)
                |
         pt_regs struct
                |
         your BPF program receives *ctx
From there you can read the function’s arguments using macros like
PT_REGS_PARM1(ctx), PT_REGS_PARM2(ctx), etc. These are architecture-aware
so they map to the right registers on x86-64, arm64, and so on.
One critical rule: if any argument is a pointer into userspace memory, you cannot
dereference it directly. The verifier will reject it. You have to use
bpf_probe_read_user() to safely copy the data into your BPF stack. Kernel
pointers you can access directly through the CO-RE helpers (more on that below).
Reading function arguments directly
The pt_regs approach works, but there’s a cleaner way. The BPF_KPROBE macro
lets you declare your BPF function with the exact same signature as the kernel
function you’re hooking.
Take tcp_sendmsg. In the kernel it looks like this:
int tcp_sendmsg(struct sock *sk, struct msghdr *msg, size_t size);With BPF_KPROBE you just mirror that signature directly:
SEC("kprobe/tcp_sendmsg")
int BPF_KPROBE(tcp_sendmsg, struct sock *sk, struct msghdr *msg, size_t size)
{
    struct tcp_event ev = {};

    if (fill_event(&ev, sk, size, EVENT_TX) < 0)
        return 0;

    bpf_perf_event_output(ctx, &events, BPF_F_CURRENT_CPU, &ev, sizeof(ev));
    return 0;
}
At the moment tcp_sendmsg is called, those arguments, sk, msg, size, are
live in CPU registers. BPF_KPROBE expands into the boilerplate that reads
them from pt_regs and hands them to your function as proper typed C variables.
So sk is a real struct sock * pointing to the socket that’s sending data.
You can pull fields off it directly, source and destination IP, ports, socket
state, whatever you need. size tells you exactly how many bytes are being sent
in this call.
This is the core idea: you hook a function, you get its arguments, you inspect the kernel’s own live data structures at the exact moment they’re being used. No guessing at offsets, no manual register math.
The only rule remains: if an argument points to userspace memory, use
bpf_probe_read_user(). Kernel structs like struct sock * you can access
directly, but keep reading for why that works reliably across kernel versions.
CO-RE: write once, run anywhere
Here’s a problem. Kernel structs like struct sock change between kernel
versions. A field might be at offset 24 in kernel 5.15 and offset 32 in 6.1.
If you hardcode struct offsets at compile time, your BPF program breaks the
moment someone runs it on a different kernel.
CO-RE (Compile Once, Run Everywhere) solves this. It’s a combination of three things working together:
BTF (BPF Type Format) is debug information the kernel embeds about its own
types, every struct, every field, every offset. Modern kernels ship with BTF
built in, exposed at /sys/kernel/btf/vmlinux.
vmlinux.h is a single header generated from that BTF data. Instead of
including dozens of kernel headers, you include one file that has the exact type
definitions for the kernel you’re running on.
bpftool btf dump file /sys/kernel/btf/vmlinux format c > vmlinux.hCO-RE relocations are annotations the compiler embeds in your .o file.
When libbpf loads your program, it reads those annotations, checks the target
kernel’s BTF, and rewrites the field offsets to match. Your program compiled on
kernel 5.15 loads correctly on kernel 6.1 because libbpf fixed the offsets at
load time.
In practice it looks like this:
#include "vmlinux.h"
#include <bpf/bpf_core_read.h>

SEC("kprobe/tcp_sendmsg")
int BPF_KPROBE(tcp_sendmsg, struct sock *sk, struct msghdr *msg, size_t size)
{
    // BPF_CORE_READ handles the offset relocation automatically
    __u16 family = BPF_CORE_READ(sk, __sk_common.skc_family);
    __u16 dport  = BPF_CORE_READ(sk, __sk_common.skc_dport);

    // ...
}
BPF_CORE_READ looks like a normal struct field access but it goes through the
CO-RE machinery. The compiler marks it as a relocatable access, and libbpf
resolves it against the target kernel’s BTF at load time.
Without CO-RE you’d be shipping pre-compiled BPF objects per kernel version, or
compiling on the target machine. With CO-RE you compile once and distribute a
single .o that works everywhere with BTF support.
Perf buffer vs ring buffer
There are two main ways to stream events from your BPF program to userspace.
Perf buffer
BPF_MAP_TYPE_PERF_EVENT_ARRAY is the original mechanism. It creates one
per-CPU circular buffer. Each CPU writes to its own buffer and userspace polls
all of them.
The problem: per-CPU allocation is wasteful. If you allocate 1MB per CPU on a 32-core machine you’ve committed 32MB even if most cores are idle. You also get events out of order across CPUs because you’re merging multiple independent streams.
Ring buffer
BPF_MAP_TYPE_RINGBUF, added in kernel 5.8, uses a single shared buffer. All
CPUs write to it, userspace reads from one place.
The advantages are real:
- one allocation shared across all CPUs
- events are ordered by submission time
- supports a reserve/commit pattern so you fill the struct in place without an extra copy
- userspace can be notified via epoll instead of busy-polling
Perf buffer:
  CPU0 → [buf0] ─┐
  CPU1 → [buf1] ─┼─→ userspace merges all
  CPU2 → [buf2] ─┘

Ring buffer:
  CPU0 ─┐
  CPU1 ─┼─→ [shared buf] ─→ userspace
  CPU2 ─┘
Unless you’re on a kernel older than 5.8, use ring buffer.
The skeleton: how userspace ties it together
Compiling your BPF C file with clang gives you a .o ELF object. But you still
need to load it into the kernel, set up the maps, and attach to the hook.
With libbpf, the modern approach is the skeleton pattern. You run:
# compile BPF code to BPF bytecode
clang -O2 -target bpf -g -c execve_trace.bpf.c -o execve_trace.bpf.o

# generate the skeleton header
bpftool gen skeleton execve_trace.bpf.o > execve_trace.skel.h

# compile the userspace loader
gcc execve_trace.c -o execve_trace -lbpf
The skeleton header has a struct representing your entire BPF program, maps, programs, links, and generated functions to manage it. Your userspace code then follows a clean three-step sequence:
#include "execve_trace.skel.h"

static int handle_event(void *ctx, void *data, size_t size)
{
    struct event *e = data;
    printf("pid=%-6d uid=%-6d comm=%s\n", e->pid, e->uid, e->comm);
    return 0;
}

int main(void)
{
    // 1. open: parse the .o, prepare internal state
    struct execve_trace_bpf *skel = execve_trace_bpf__open();

    // 2. load: verify and load into kernel via bpf() syscall
    execve_trace_bpf__load(skel);

    // 3. attach: create the kprobe and wire the program to it
    execve_trace_bpf__attach(skel);

    // consume events from the ring buffer
    struct ring_buffer *rb = ring_buffer__new(
        bpf_map__fd(skel->maps.events),
        handle_event, NULL, NULL
    );

    while (1)
        ring_buffer__poll(rb, 100);
}
Open, Load, Attach. That’s the whole thing. Under the hood __load calls
bpf(BPF_PROG_LOAD, ...) which triggers the verifier, and __attach calls
bpf(BPF_LINK_CREATE, ...) which installs the kprobe. After that your program
is live.
The skeleton handles all the boilerplate so you’re not manually calling the
bpf() syscall with magic integers and hand-rolled structs.
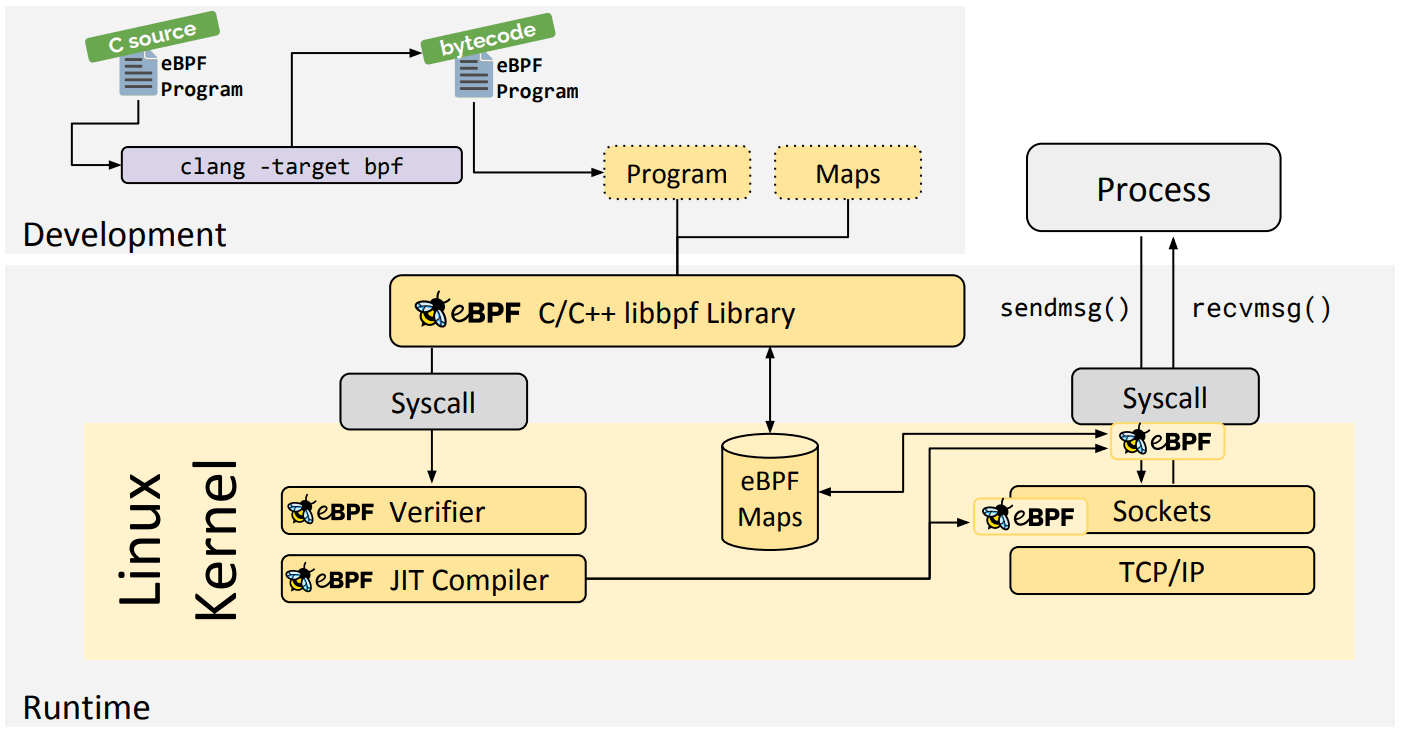
Before we wrap up, here’s a quick visual to anchor the flow.
Tagged: linuxebpfnetwork-security